 |
You are here: Info » resources » articles » mtf-chart
An ideal lens would perfectly transmit 100% of the light that passes though it. But, no lens is perfect, and therefore there are losses. When these losses are measured in terms of contrast this is called the modulation of contrast. In other words, how much contrast is lost — modulation simply being another word for variance.
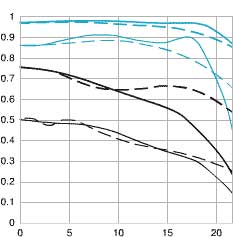
The vertical axis shows numbers from 0 to 1, which is really shorthand for 0 to 100%. Therefore .10 means 10% contrast, .5 is 50% contrast, and 1 is 100% contrast.
The horizontal axis is in millimeters and shows the distance from the center of the image toward the edges. In other words, 0 on the horizontal axis is the center of the lens and 20 is 20mm out from the center. Since a 35mm frame is nominally 36mm across this point is therefore at the edge of the frame.
The thick lines are measurements taken at 10 LP/mm (low spatial frequency, or low resolution) and the thin lines are at 30 LP/mm, at higher frequency / higher resolution.
The black lines are measurements taken with the lens wide open, and the blue lines are with the lens at f/8.
The solid lines are meridonial while the dotted lines represent sagittal measurements.
Here are some rules of thumb for reading a chart...
— the higher up the chart the 10 LP/mm line is (the thick lines), the higher the contrast reproduction capability of the lens will be.
— the higher up the chart the 30 LP/mm line is (the thin lines), the higher the resolving power and thus subjective sharpness of the lens will be.
— keep in mind that the black lines show the lens wide open while the blue lines show the lens stopped down to f/8, so the closer these sets of lines are to each other the better the performance of the lens when used wide open. The very best lenses will have the black and the blue lines close together.
— generally speaking a lens whose thick lines (10 LP/mm) are above .8 on the chart should be regarded as having excellent image quality. Above .6 is regarded as “satisfactory”. Below .6 is, well, below.
Here are some MTF charts: